Progress Measurement for Canada’s Sustainable Development Goals
Introduction
The 2030 Agenda for Sustainable Development, adopted by all United Nations Member States in 2015, provides a blueprint for improving the economy, society, and the environment in a sustainable manner. At its heart, the 17 Sustainable Development Goals (SDGs) are a universal call to action to end poverty, protect the planet, and ensure that all people globally can enjoy peace and prosperity.
The goals are underpinned by a framework of global indicators that allow Canada and other countries to monitor and report on progress. They cover a broad range of social, environmental, and economic issues with a focus on the most vulnerable and a commitment to “leave no one behind”. To complement the global goals, countries are encouraged to develop a national implementation plan that focuses on country-developed indicators to address specific national contexts and priorities to achieve the SDGs.
To support the Government of Canada’s commitment to a domestic implementation of the SDGs, a national strategy has been established. In addition, the development of a Canadian-specific indicator framework was an opportunity to elaborate on the UN goals with a set of indicators that align more closely with Canada’s domestic priorities in sustainable development.
Measuring Progress
Measuring and monitoring progress with reliable information is key to understanding how a country advances towards the achievement of the SDGs.
Closely monitoring the progress of each indicator not only shows where a country is making progress or falling behind, which helps to better focus its efforts, but also communicates how the country is performing in an open and transparent manner. A robust measure of progress quantifies an indicator’s progress towards reaching the target in a scientific manner and can be used as a tool to better understand success of policies and actions taken to achieve those targets. It can also act as a clear signal to decision-makers to readjust or develop effective evidence-based policies to help ensure the country achieves its targets.
Methodology Adopted
The Global Indicator Framework (GIF) lays the foundation for Canada and all other countries to measure and report their progress towards the 17 SDGs. The GIF divides the 17 SDGs across 169 targets and 234 unique indicators, all of which were agreed upon and are measured consistently by all United Nations Member States. The Canadian Indicator Framework (CIF) focuses on Canadian priorities for sustainable development and can be considered a complement to the GIF. The CIF complements the 17 SDGs with 33 ambitions and 86 indicators that are specific to Canada. Across the GIF and the CIF, indicators may have defined quantitative targets (e.g., GIF 1.2 and CIF 1.1 both target a 50% reduction of the poverty rate according to national definitions), aspirational targets (e.g., CIF target 5.3 Greater representation of women in leadership roles), or no target at all.
To complement the GIF and the CIF, Statistics Canada has developed a robust and simple method of measuring progress which can be reported using visualizations that allow data users to easily see areas of progress or weakness. Even in the absence of specific quantitative targets, an estimate of progress can inform whether undesired trends are being observed by reporting progress deterioration. In essence, this measure of progress provides a simplified illustration of Canada’s progress towards achieving the SDGs, assuming that the current trends are maintained.
Requirements
Statistics Canada identified essential requirements for the adopted methodology. The guiding principle for the methodology was the necessity of a consistent and easily interpretable measure that could reach a broad audience while maintaining scientific integrity.
More specifically, the methodology must:
- Allow for different data periodicity and timeliness: Data series available in Canada have various collection calendars and reference periods. Some are collected every year while others are collected every few years. Furthermore, the time required between the collection of data and release of official statistics varies greatly between programs.
- Provide a calculation for measuring progress in the absence of a quantitative target: To gain a greater understanding of policy impacts and progress towards the achievements of the SDGs, it is crucial to be able to assess progress in the absence of a specific numerical target.
- Allow for the calculation of an aggregate measure, whether at the target, ambition, or goal level: When used appropriately, a composite measure of progress is valuable to leaders and policymakers to help steer policy and actions towards making progress to achieve the SDGs.
The adopted methodology cannot rely on:
- The need to create a target when there is none. As a statistical agency, we remain politically neutral. Therefore, it is outside the scope of our mandate to assign targets. Thus, the methodology must be valid even in the absence of a target.
- Indicator-specific thresholds for progress categories: It was assessed that using different criteria for each indicator would put too much emphasis on the method rather than the message and overall progress. Therefore, the methodology developed uses a straightforward and consistent method across all indicators.
- The existence of extended time series: Many issues covered in the SDGs haven’t been measured for an extended period. Opting for a methodology that is robust despite a shorter time series allows for a considerable increase in the number of indicators for which progress can be calculated.
- Modelling: Similar to item 3, modelling usually requires a longer time series which will reduce the number of indicators eligible for calculation of the progress measure.
Methodology
The progress measure consists of a measure of observed growth compared to an evaluation of the proximity to achieving the target under current conditions. In situations where no quantitative target is provided, the time series is evaluated on the apparent trend of the data.
Keeping in mind the limited number of data points in each time series and a desire to keep the methodology simple and transparent, the optimal methodology for measuring progress was inspired by the progress methodology used by Eurostat.1
Progress is measured using the growth over the observed period and is calculated by a compound annual growth rate,

where
CAGRi is the observed compound annual growth rate between t0 and ti,
yi is the value of the indicator at time ti,
ti is the most recent year where data is available,
t0 is the base year, 2015, unless otherwise specified, and
y0 is the value of the indicator in the base year.
Indicators with quantitative targets
In the case where a quantitative target for the indicator is provided, the observed CAGRi is compared to the magnitude of the theoretical CAGRT, which represents the annual growth rate that would be required to achieve the target on time, by calculating the ratio (R) as follows:

where

yT is the target value of the indicator in the target year, tT, and
d is +1 when the desired progress is in the positive direction and -1 when the desired progress is in the negative direction.
This formula represents the ratio of the observed growth rate compared to the growth rate required to reach the target while accounting for certain edge cases where the direction to the target differs from the desired direction of progress (e.g., some cases where the base value achieves the target).
The result is compared against a set of thresholds2 and assigned a progress category as described in the table below:
| Ratio of observed over required growth rate | Category | Symbol |
|---|---|---|
| Target is achieved | Target achieved | 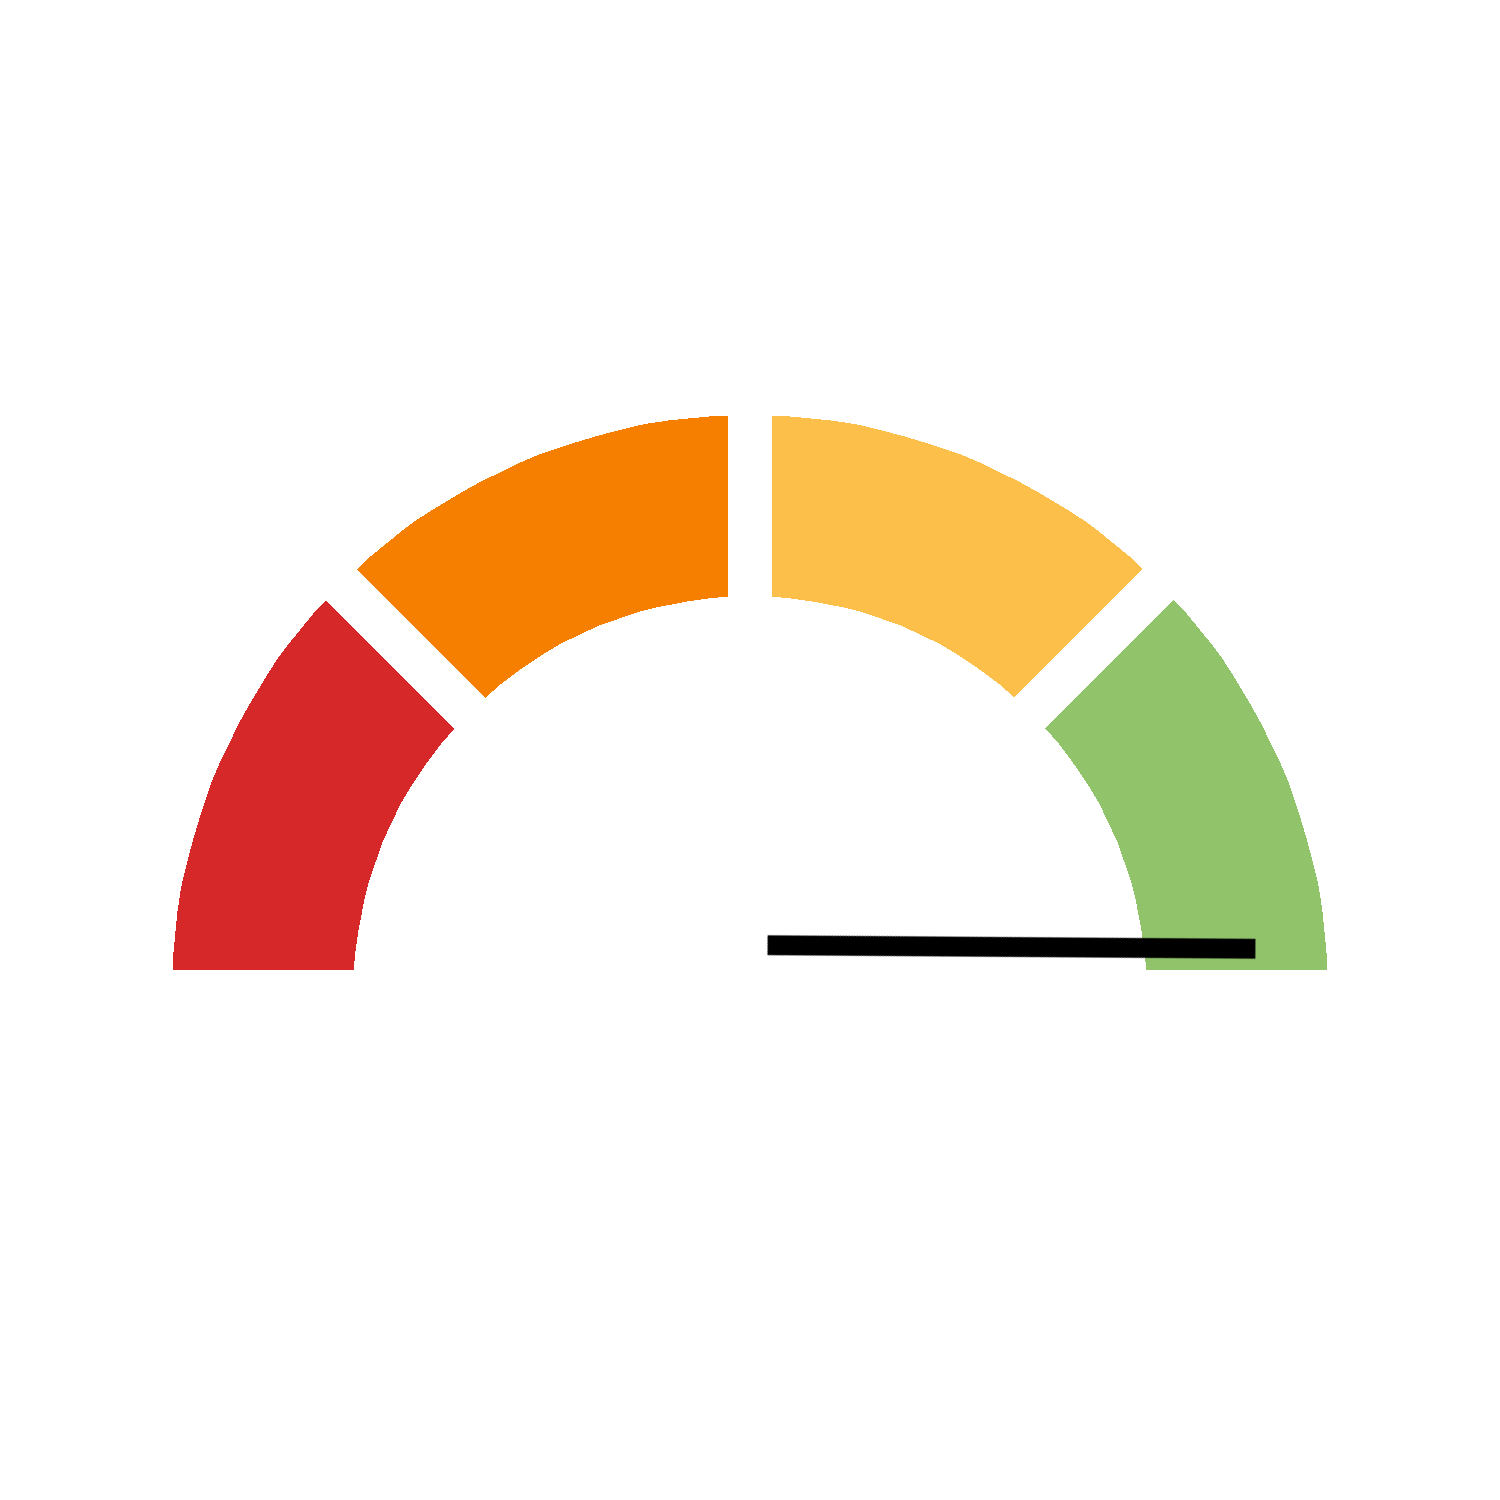 |
| R ≥ 95% | On track |  |
| 60% ≤ R < 95% | Progress made but acceleration needed | 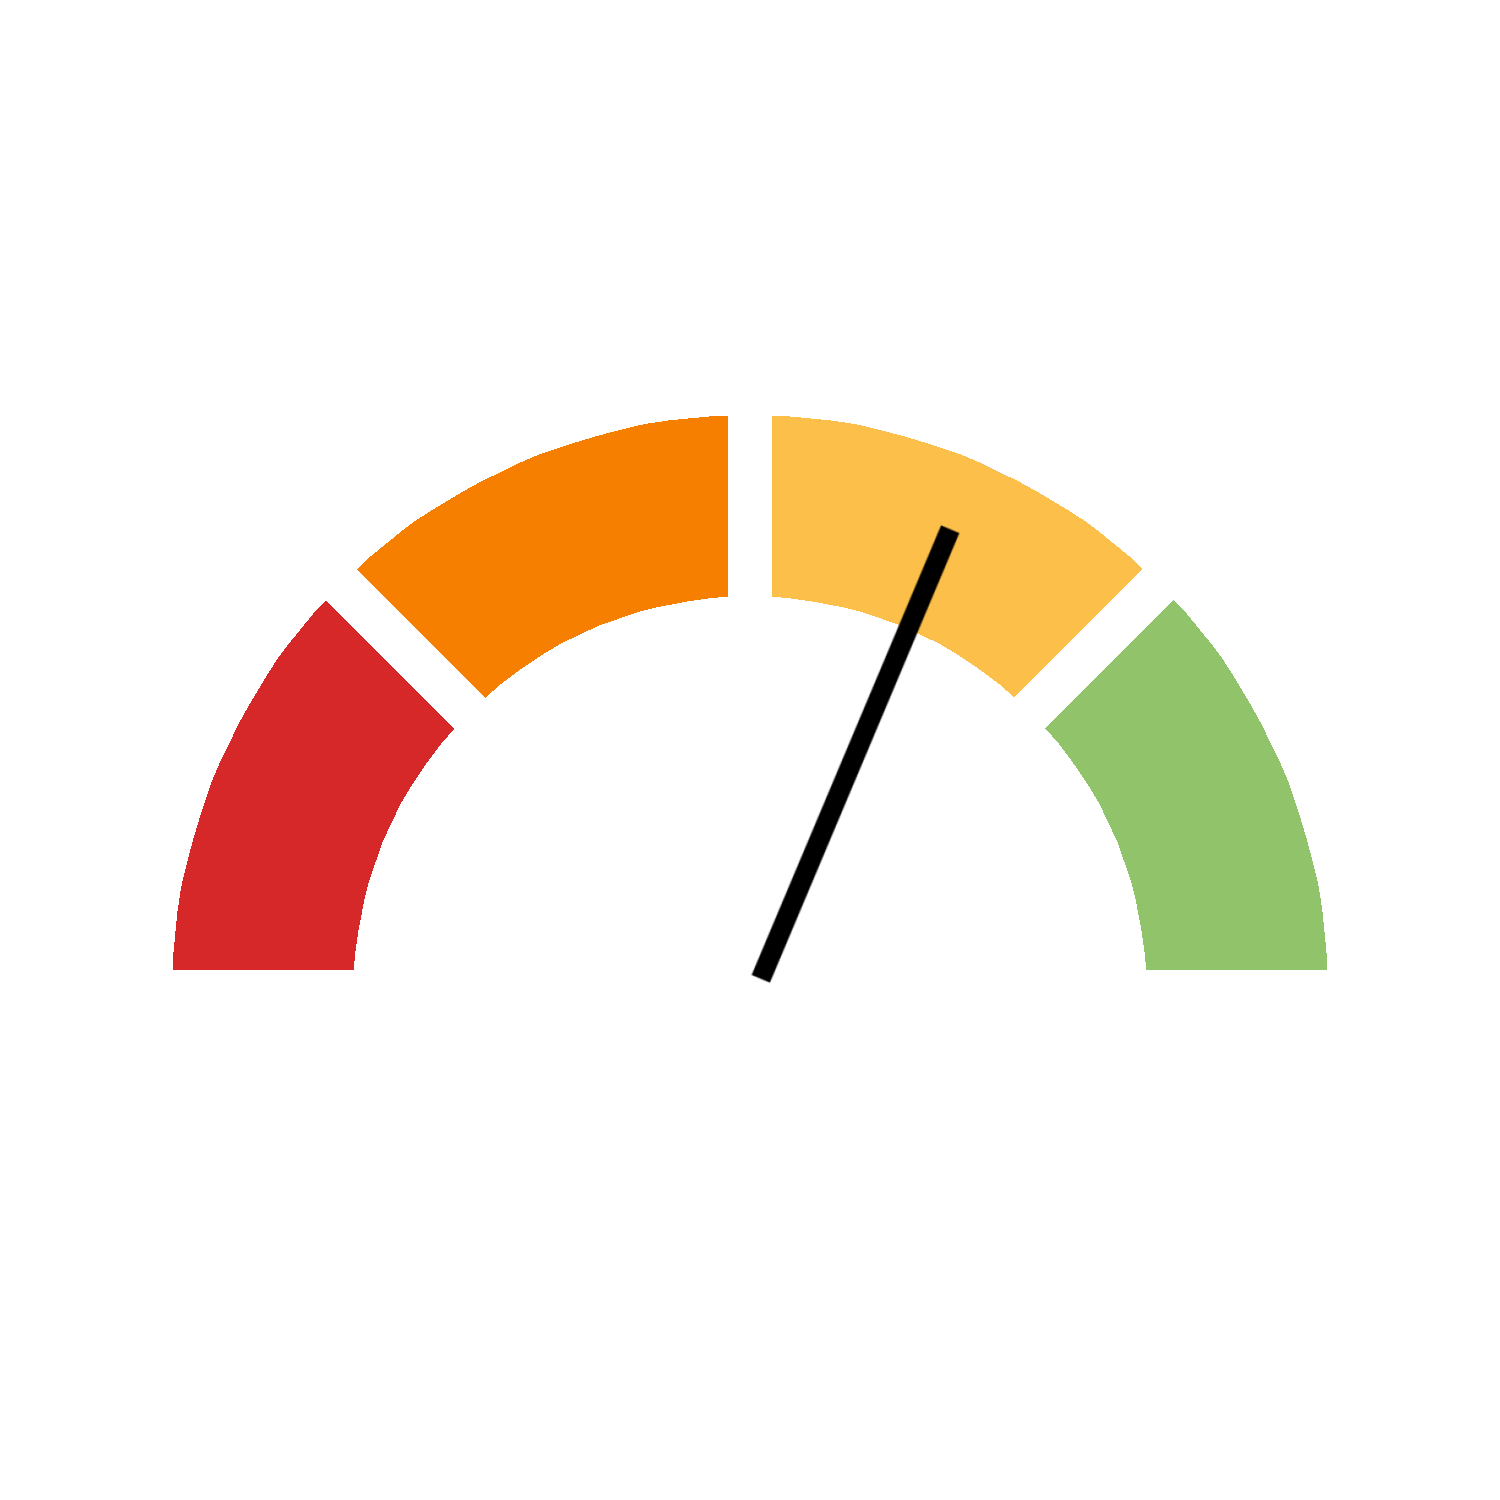 |
| 0% ≤ R < 60% | Limited progress | 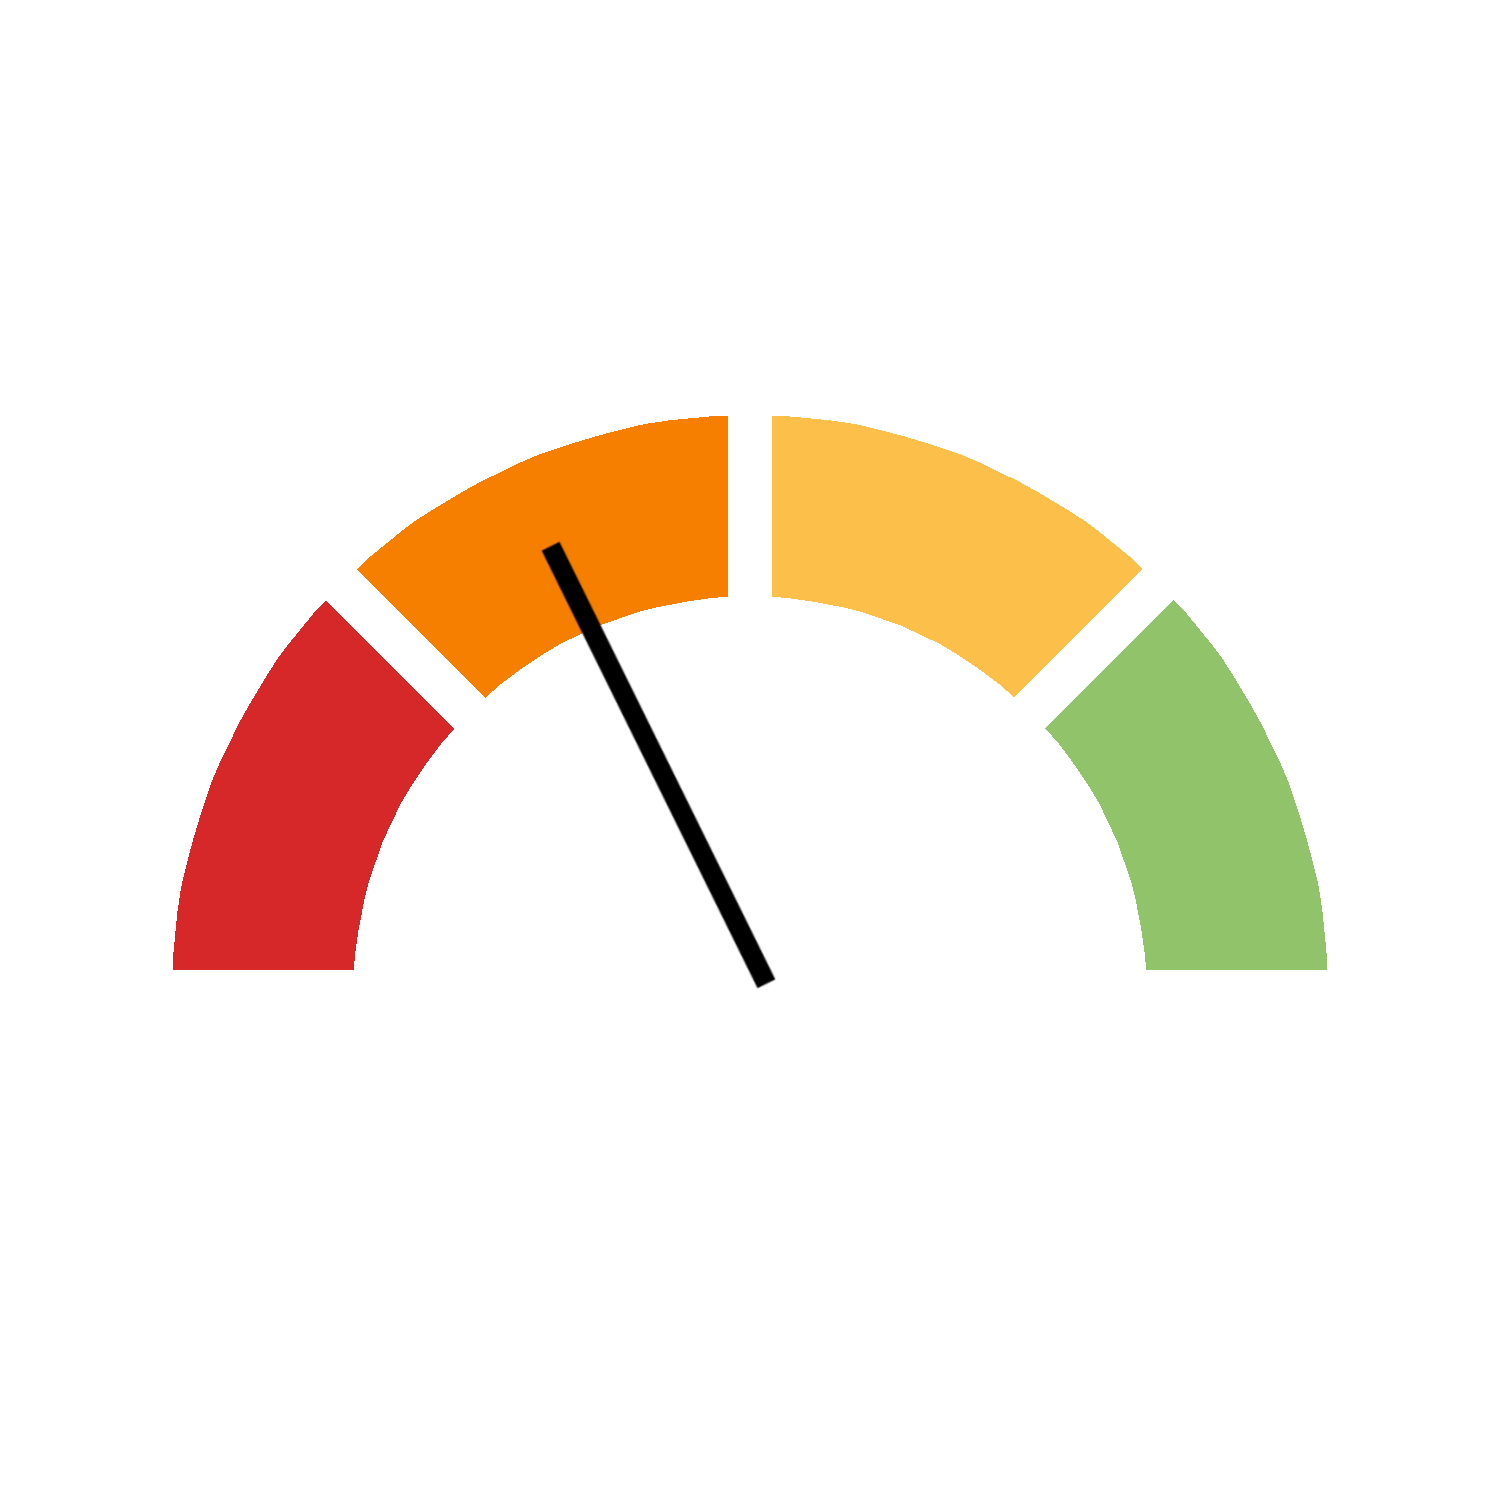 |
| R < 0% | Deterioration | 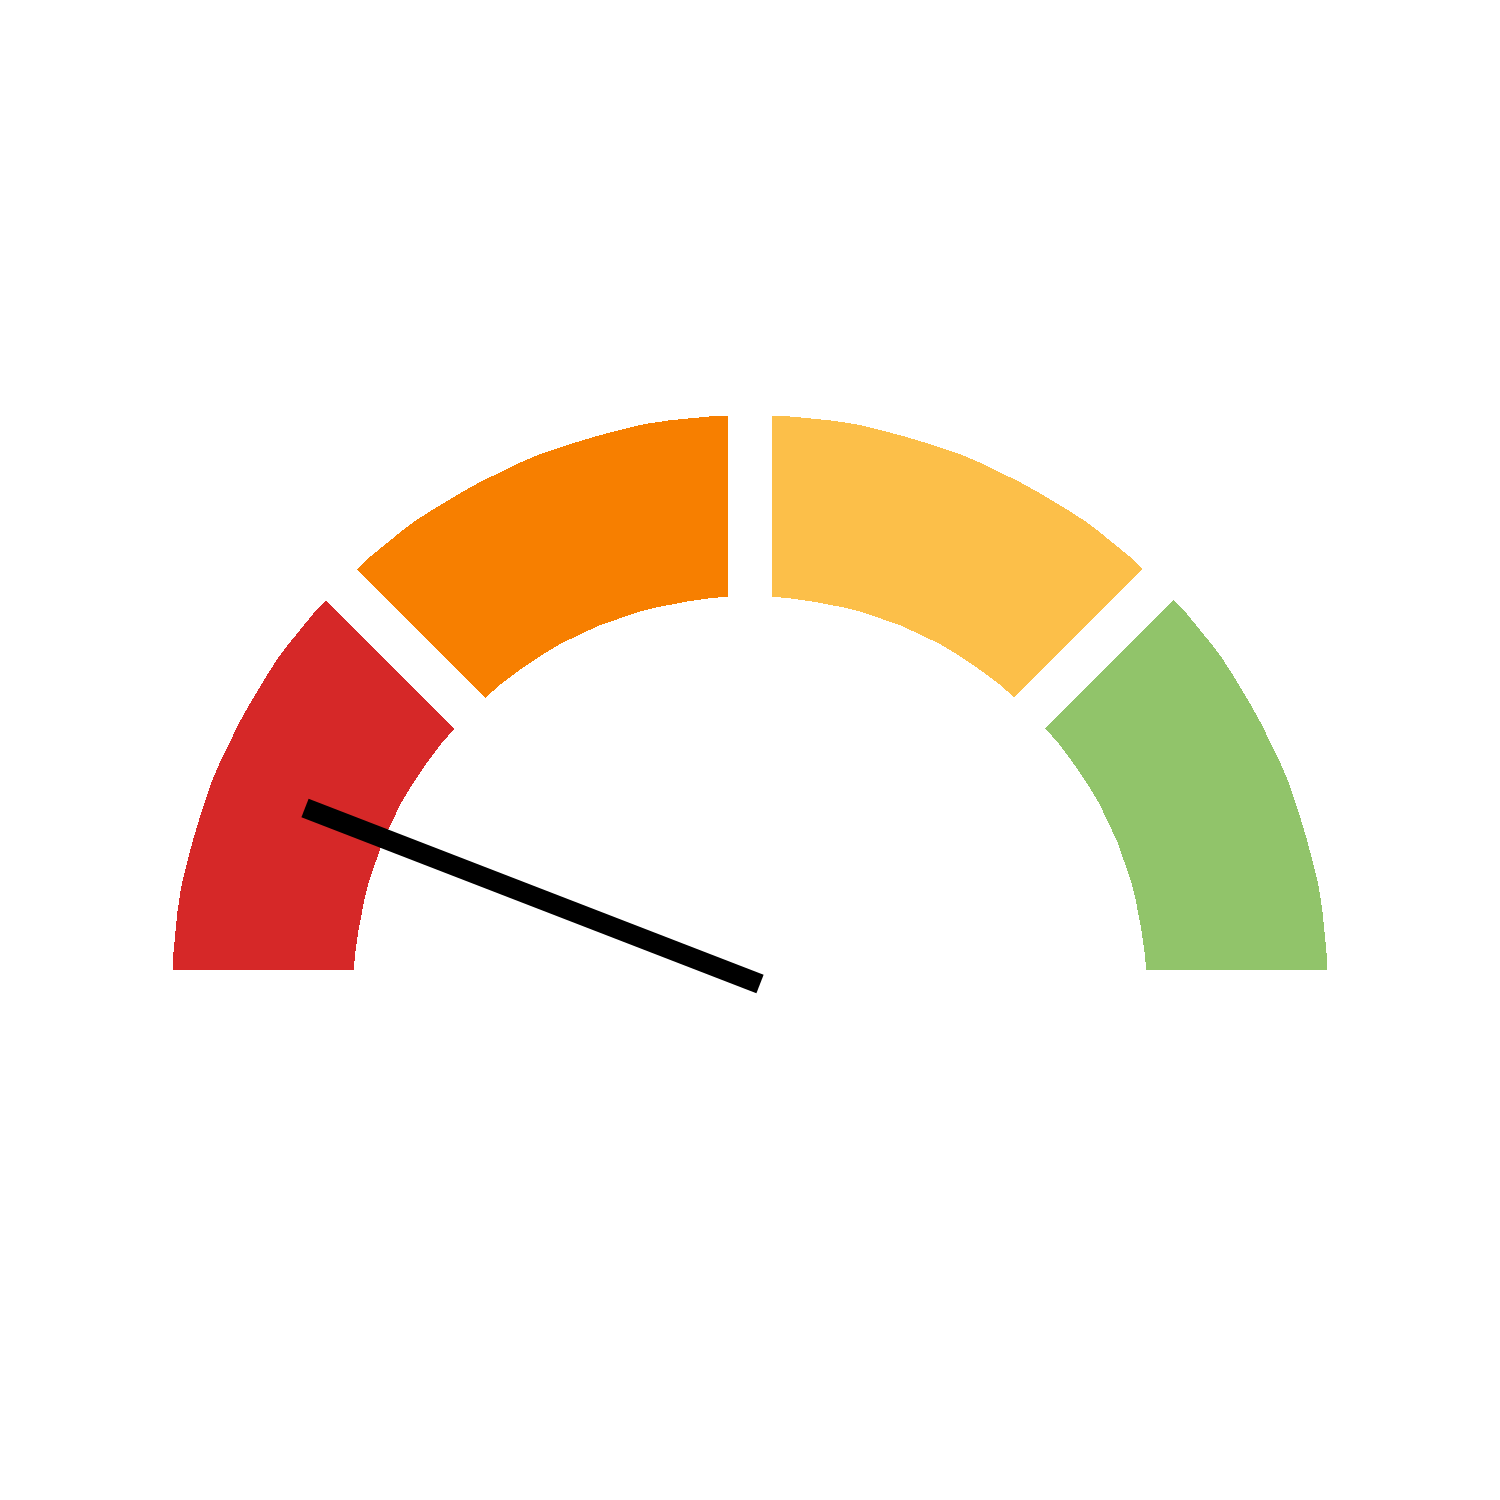 |
Indicators without quantitative targets
In the case where no quantitative target for a given indicator has been provided, the observed compound annual growth rate is compared to predetermined fixed growth rates while also accounting for the desired direction of progress.

The thresholds are described in the table below:
| Observed growth rate | Category | Symbol |
|---|---|---|
| CAGR ≥ 1.5% C* | On track | |
| 0.5% C* ≤ CAGR < 1.5% C* | Progress made but acceleration needed | |
| 0% ≤ CAGR < 0.5% C* | Limited progress | |
| CAGR < 0% | Deterioration | |
*The scaling factor C is only applied for indicators with natural limits as defined below. It is a variable between 0 and 1 that reduces thresholds greater than 0% to produce more realistic progress assessments near limits.
In some cases, indicators may have natural maximum or minimum limits. For example, CIF indicator 9.4.1 Proportion of Canadians that have access to the latest generally deployed mobile wireless technology cannot exceed a maximum limit of 100%. If the value of the indicator in the base year is already near the natural limit, it may be impossible to achieve the growth rates required to attain a progress status of “On track” or “Progress made but acceleration needed” without exceeding the maximum limit of 100%. In these cases, the growth rate thresholds presented in the table are scaled down by a factor that accounts for the base value y0 and natural limit ylim of the indicator. Progress thresholds greater than 0% are reduced by a factor of

where the first case (0 ≤ y0 < ylim) covers situations with a maximum limit and the last two cases cover situations with a minimum limit. The scaling factor, C, is a variable between 0 and 1 that reduces the progress thresholds according to the proximity between the base value and the limit. If the base value is very close to the limit, C will be near zero and will aggressively reduce the thresholds to allow a more realistic range of progress assessments. Alternatively, if the base value is far from the limit, C will be near 1 and will have a minimal impact on the final progress assessment for the indicator.
The scaling factor defined above was chosen to optimally reduce the progress thresholds in a way that (1) ensures the possibility of attaining a progress status of “On track” without exceeding the limit throughout the first 15 years,3 (2) ensures the reduction factor is identical at equal relative distances from a minimum or a maximum limit, and (3) poses a minimal effect on the thresholds used at intermediate values and those values far away from the limit.4
Only a limit that affects progress in the desired direction is considered. For example, a maximum limit is not considered for indicators whose desired direction of progress is negative. Also, the scaling factor is not applied to thresholds less than or equal to zero (thresholds ≤ 0%), which represent movement in the inverse direction from the desired direction of progress.
Aggregated progress status
In some instances, an indicator may not have an explicit headline series or may be composed of many sub-indicators of equal importance. For example, CIF indicator 5.3.1 Proportion of leadership roles held by women provides an assortment of data series for women in various leadership positions. In these situations, the trend of each series is considered in making a final progress assessment for the indicator as a whole.
To do so, the progress value (R for indicators with quantitative targets and CAGR for indicators without quantitative targets) for each relevant series is converted to a score. The score is obtained from a linear transformation of the progress value to a score that ranges from -5 for indicators showing substantial deterioration to +5 for indicators showing substantial progress (see Figures 1 and 2). The score range is divided equally between all four progress categories: scores between 2.5 and 5 belong to the “On track” category, scores between 0 and 2.5 belong to the “Progress made but acceleration needed” category, scores between -2.5 and 0 belong to the “Limited progress” category, and scores between -5 and -2.5 belong to the “Deterioration” category.
| Symbol | Category | Score |
|---|---|---|
|
Target achieved | 5* |
|
On track | [2.5, 5] |
|
Progress made but acceleration needed | [0, 2.5[ |
|
Limited progress | [-2.5, 0[ |
|
Deterioration | [-5, -2.5[ |
*Only applicable for indicators with quantitative targets. Indicators that achieve the target are automatically assigned a score of 5 regardless of the underlying trend.
For indicators without quantitative targets, the cut-off thresholds are 2% for a score of +5 and -2% for a score of -5 as illustrated in Figure 1 below. If applicable, thresholds greater than 0% are reduced by the scaling factor C to maintain consistency between scores for indicators with a limit and indicators without a limit.

For indicators with quantitative targets, the cut-off thresholds are 130% for a score of +5 and -60% for a score of -5 as illustrated in Figure 2 below.

The mean of the progress scores from each series is taken as the overall progress score for the indicator. The aggregate progress status is determined directly from the overall progress score according to the defined ranges of each progress category. For example, the aggregate progress status for an indicator with an overall score of +1 is “Progress made but acceleration needed”.
Any series that achieves its target is automatically assigned a progress score of +5. However, all series must achieve the target for the aggregate progress status to be “Target achieved”.
Sub-indicator grouping
In rare cases, sub-indicators may be reported via multiple series (sub-sub-indicators). In this situation, the progress scores from each series grouped within the sub-indicator are determined and averaged together before passing along the group’s mean score to be used in the next steps of the aggregate progress calculation of the indicator. For example, GIF indicator 1.4.1 Proportion of population living in households with access to basic services is composed of many sub-indicators covering access to different forms of basic services. Each basic service should be accorded equal weighting in the determination of the progress score for this indicator. However, the Access to basic education sub-indicator is itself composed of multiple sub-sub-indicators that cover a range of age groups and subjects. Therefore, the progress scores from each available sub-sub-indicator are grouped together and averaged, resulting in a single mean progress score for the Access to basic education sub-indicator. The mean of the progress scores from each sub-indicator (where some of the sub-indicators’ scores may themselves be the result of an averaged group of sub-sub-indicator scores) then becomes the final aggregate progress score for the indicator. Grouping depth is not limited. This grouping method guarantees that sub-indicators are weighted equally when assigning a progress status to the indicator.
Considerations and Exceptions
Special considerations for the base value and the target value
The progress measurement methodology uses an exponential model to evaluate the growth rate of an indicator observed to date against various thresholds. As an exponential model, it cannot handle cases where either the base value or the target is zero. Therefore, unless otherwise specified, the following replacements are performed automatically:
- If the target value is zero, it is replaced by 0.001 in the calculation of the progress measure.
- If the base value is zero, it is replaced by 0.001 in the calculation of the progress measure.
Generally, care should be taken to manually select an appropriate replacement value. For example, a target of zero could be replaced by a suitably small number like 1 or 0.001, but the latter is a factor of 1000 smaller than the former, which could significantly impact the final progress assessment.
Another special consideration for the base value comes when it is exactly equal to the natural limit (y0 = ylim) of an indicator without a quantitative target. In this case, the scaling factor C will be exactly zero, meaning all progress thresholds greater than 0% will be reduced to zero as well. In such a situation, if the calculated progress value is zero or greater (CAGR ≥ 0), the current value is maintained at the limit (or may even exceed the limit) and a progress status of “On track” as well as a score of +5 are assigned to the series. However, if the calculated progress value is negative (CAGR < 0), the progress score and status can be determined as usual.
Special considerations for the base year and the target year
The 2030 Agenda for Sustainable Development was adopted in 2015 to catalyze progress towards the 17 Sustainable Development Goals by 2030. As such, the base year is assumed to be 2015 and the target year is assumed to be 2030 unless specified otherwise. Even when the target results from a policy that was implemented after 2015, the base year will be 2015 when data exists unless otherwise specified. This approach ensures coherence and comparability across assessments, in alignment with Statistics Canada’s dimensions of data quality.
Should there be no available data for 2015, the first available year following 2015 will be used. In very few cases where the periodicity of the data is over 4 years or more, a base year of 2014 may be used instead. Additionally, if the reference period spans multiple years, the first year is used as the reference period. For example, the reference period 2015-16 is interpreted as the reference year 2015 in the progress calculation.
Minimum data requirements
The data must meet certain requirements in order to produce a progress assessment.
- At least two years of data is required to calculate the progress measure.
- As the described progress measure methodology is based on an exponential growth model, it is valid only when all values are positive or all values are negative. If all values are negative, the desired direction of progress is flipped in the progress measure calculation.
When the data for an indicator does not meet these minimum requirements, the progress status will be reported as “Unable to assess”.
In rare cases, when the relevant experts have determined that a progress assessment would hinder the interpretation of the indicator data, the progress status will instead be reported as “Not available”.
Binary indicators
Binary or non-statitical indicators are categorized as follows:
- “Target achieved” if all conditions for meeting the target have been met.
- “Target not achieved” if one or more conditions for meeting the target have not been met.
Interpretation
The progress assessments generated by the outlined methodology oversimplify reality. The methodology may produce better results when applied to indicators demonstrating a trend of continuous exponential growth year after year than when applied to other types of indicators. Results for indicators where the base value or the target value is zero should also be interpreted carefully due to the limitations of the underlying model. Importantly, it takes time for policies to yield measurable results. Users should interpret the reported progress status accordingly, alongside any other relevant contextual information.
Specific exceptions for the Canadian Indicator Framework
To overcome certain limitations of the progress measurement methodology, data may be transformed into an equivalent valid form before calculating progress. Such transformations are intended to enable consistent progress measurements across a greater number of indicators.
Goldilocks indicators
For some indicators, it is desirable to approach and meet the target, but exceeding it may have negative consequences. We have labelled indicators with these types of targets as “Goldilocks” indicators because being far above the target is “too cold”, being below the target is “too hot”, while achieving the target is deemed “just right”. The results improve as we approach the target and worsen as we move away from the target in either direction. The methods used to address this type of target are described below:
- CIF indicator 5.4.1 Proportion of time spent on unpaid domestic and care work: The stated target is “equal sharing of parenting roles and family responsibilities” and it is interpreted as meaning the time spent on unpaid domestic and care work for men and women should be equal. As such, this indicator’s data is transformed into a measure of the ratio of the time spent on unpaid domestic and care work between men and women. To ensure that inequities in either direction are handled fairly and equally, both the ratio of time spent by women to men and the reciprocal ratio of time spent by men to women are determined. The transformed value used in subsequent progress calculations is whichever is larger between the ratio of women to men and the ratio of men to women: max(fi⁄mi, mi⁄fi ), where fi represents the observed time spent by women on unpaid domestic and care work and mi represents the observed time spent by men on unpaid domestic and care work. Therefore, women spending twice as much time as men on unpaid domestic and care work is measured equally to the reciprocal situation, in which men spend twice as much time as women on unpaid domestic and care work. The desired progression is a reduction towards a target ratio of 1. However, a reduction in the total time spent on domestic and care work from all genders may not be the desired outcome as it may indicate growing neglect rather than gender equality. Therefore, caution should be exercised when interpreting the progress of this indicator.
Unit transformations
The methodology is not applicable to indicators that allow both negative and positive values, such as indicators measuring percent change or growth rates. When possible, the values for these types of indicators should be transformed into unit types that are compatible with the progress measurement methodology before performing the progress calculations.
CIF indicator 15.3.1 Canadian Species Index reports the cumulative percent change of the Canadian Species Index since 1970. Cumulative percent change values are unsuitable for the described progress measure methodology because both positive and negative values are allowed. Therefore, the progress measure is calculated by first transforming the indicator data from a relative measure to an absolute one. The base value in 1970 can be set to 1 and the following years’ values are converted by applying the cumulative percent change to this base value. For example, in 2015, the cumulative percent change since 1970 was -6.61%, so 1(1-0.0661) = 0.9399 is taken as the value for 2015 in the progress measure calculation.
Other transformations
CIF indicator 16.4.1 Civil Court case completion time reports progress based on the proportion of cases that are completed in 6 months or less, which is equal to the sum of the percentage of cases completed in less than or equal to 3 months and the percentage of cases completed in greater than 3 months to 6 months. The desired progress is in the positive direction, i.e., to increase the proportion of Civil Court cases that are completed in 6 months or less.
Community
The progress measure methodology described above is applied throughout Statistics Canada’s Data Hubs for the SDGs. At a glance, users can interpret indicator-level progress towards Canada’s sustainable development goals!
Statistics Canada’s SDG team is working with the Open SDG community to integrate the indicator-level progress measurement into the back-end of the Open SDG platform. The official release of the progress measurement functionality is coming soon with the launch of Open SDG 2.4.0.
Please contact us if you have any questions or want to know more about Statistics Canada’s progress measurement methodology for the Sustainable Development Goals.
Metadata
Canadian Indicator Framework
The table below provides the targets and desired directions used by Statistics Canada to measure Canada’s progress across the CIF.
| Indicator number | Indicator name | Target or desired direction |
|---|---|---|
| 1.1.1 | Poverty rate, as measured by Canada’s official poverty line | ≤ 7.25% |
| 1.2.1 | Prevalence of asset resilience | Increase |
| 1.3.1 | Debt to disposable income ratio | Decrease |
| 1.4.1 | Median household after-tax income | Increase |
| 2.1.1 | Prevalence of food insecurity | Decrease |
| 2.2.1 | Index of Agri-Environmental Sustainability | Score ≥ 71 |
| 3.1.1 | Percentage of Canadians who report eating fruits and vegetables 5 or more times per day | Increase |
| 3.2.1 | Percentage of youth (aged 12 to 17) who have used an e-cigarette in the past 30 days | ≤ 10% |
| 3.3.1 | Proportion of the population living with obesity | ≤ 8 litres |
| 3.4.1 | Alcohol per capita consumption (aged 15 years and older) within a calendar year in litres of pure alcohol | Decrease |
| 3.5.1 | Proportion of Canadians meeting the 2020 Canadian physical activity guidelines | Increase |
| 3.6.1 | Percentage of Canadians who are satisfied or very satisfied with their life | Increase |
| 3.7.1 | Percentage of Canadians who perceived their overall health as very good to excellent | Increase |
| 3.8.1 | Percentage of Canadians who perceived their mental health as very good to excellent | Increase |
| 3.9.1 | Vaccination rates for selected diseases | Child ≥ 95%; Adolescent ≥ 90% |
| 3.10.1 | Incidence of selected diseases | Decrease |
| 3.11.1 | Mortality rate for selected causes of death | Decrease |
| 3.12.1 | Tuberculosis incidence per 100,000 population in Inuit Nunangat | 0 |
| 3.13.1 | Rate of apparent opioid toxicity deaths per 100,000 population | ≤ 10 |
| 3.14.1 | Percentage of Canadians (aged 18+) who currently smoke cigarettes | ≤ 5% |
| 3.15.1 | Proportion of persons with unmet health care needs | Decrease |
| 4.1.1 | High school completion rate | Increase |
| 4.2.1 | Post-secondary education attainment rate | Increase |
| 4.3.1 | Proportion of children aged 0 to 5 years who use any forms of early learning and child care services | Increase |
| 5.1.1 | Proportion of the population who self-reported being sexually assaulted in the last 12 months | Decrease |
| 5.2.1 | Proportion of women and girls aged 15 years and older subjected to physical, sexual or psychological violence by a current or former intimate partner in the last 12 months | ≤ 11.5% |
| 5.3.1 | Proportion of leadership roles held by women | Increase |
| 5.4.1 | Proportion of time spent on unpaid domestic and care work | Ratio = 1 |
| 5.5.1 | Median hourly gender wage ratio | Increase |
| 6.1.1 | Number of long-term drinking water advisories on public systems on reserves | < 1 |
| 6.2.1 | Percentage of municipalities across Canada with sustained drinking water advisories | Decrease |
| 6.3.1 | Water use growth rate | Decrease |
| 6.4.1 | Water quality in Canadian rivers | Increase |
| 6.5.1 | Percentage of wastewater systems on reserves where effluent quality standards are achieved | ≥ 85% |
| 6.6.1 | Percentage of wastewater systems in Canada where effluent quality standards are achieved | 100% |
| 7.1.1 | Total annual energy savings resulting from adoption of energy efficiency codes, standards and practices | ≥ 600 |
| 7.2.1 | Proportion of electricity generated from renewable and other non-greenhouse gas emitting sources | ≥ 90% |
| 7.3.1 | Total energy consumption per capita | Decrease |
| 8.1.1 | Unemployment rate | Decrease |
| 8.2.1 | Employment rate | Increase |
| 8.3.1 | Proportion of youth not in education, employment or training | Decrease |
| 8.4.1 | Rate of involuntary part-time work | Decrease |
| 8.5.1 | Gross domestic product per capita | Increase |
| 8.6.1 | Jobs in the clean technology products sector | ≥ 244,715 |
| 9.1.1 | Proportion of enterprises that introduced innovations with environmental benefits | Increase |
| 9.2.1 | Gross domestic expenditure on research and development intensity | Increase |
| 9.3.1 | Proportion of households that have access to broadband Internet service at speeds of 50/10 Mbps | 100% |
| 9.4.1 | Proportion of Canadians that have access to the latest generally deployed mobile wireless technology | Increase |
| 9.5.1 | Greenhouse gas emissions per dollar of value-added from the production of infrastructure assets | Decrease |
| 9.6.1 | Number of publicly available electric vehicle charging and alternative fuelling stations in Canada | ≥ +30%/year |
| 9.7.1 | Remaining useful service life ratio of infrastructure assets | > 50% |
| 10.1.1 | Gini Coefficient | Decrease |
| 10.2.1 | Proportion of the population reporting discrimination or unfair treatment | Decrease |
| 11.1.1 | (a) Number of shelter users experiencing chronic homelessness; and (b) percentage change in the number of shelter users experiencing chronic homelessness from the 2016 baseline | (a) ≤ 13,433 |
| 11.2.1 | Proportion of households in core housing need | Decrease |
| 11.3.1 | Percentage of the population living in areas where air pollutant concentrations are less than or equal to the 2020 Canadian Ambient Air Quality Standards | ≥ 85% |
| 11.4.1 | Percentage of the population living within 500 metres of a public transport stop | Increase |
| 11.5.1 | Proportion of commuters using sustainable transportation | ≥ 22% |
| 11.6.1 | Total waste disposal per capita | ≤ 490 kg/person |
| 11.7.1 | Proportion of the population aged 12 and over who reported their sense of belonging to their local community as being very strong or somewhat strong | Increase |
| 12.1.1 | Proportion of new light duty vehicle registrations that are zero-emission vehicles | ≥ 60% |
| 12.2.1 | Proportion of businesses that adopted selected environmental protection activities and management practices | Increase |
| 12.3.1 | Total waste diversion per capita | Increase |
| 12.4.1 | Proportion of discarded plastic leaked permanently into the environment | Decrease |
| 13.1.1 | Greenhouse gas emissions | ≤ 456.89 |
| 13.2.1 | Deaths due to exposure to excessive natural heat | Decrease |
| 13.3.1 | Proportion of municipal organizations who factored climate change adaptation into their decision-making process | Increase |
| 13.4.1 | Flood protection infrastructure spending | Increase |
| 14.1.1 | Proportion of marine and coastal areas conserved | ≥ 30% |
| 14.2.1 | Proportion of key fish stocks in the Cautious and Healthy zones | ≥ 55% |
| 15.1.1 | Proportion of native wild species ranked secure or apparently secure according to the national extinction risk level | Increase |
| 15.2.1 | Proportion of species at risk showing progress towards their population and distribution objectives | ≥ 60% |
| 15.3.1 | Canadian species index | Increase |
| 15.4.1 | Proportion of Canada’s land and inland waters conserved | ≥ 30% |
| 15.5.1 | Proportion of the sustainable wood supply harvested | < 100% |
| 15.6.1 | Forest area as a proportion of total land area | No change |
| 16.1.1 | Proportion of Canadians who reported feeling safe walking alone in their neighbourhood after dark | Increase |
| 16.2.1 | Incidence of selected types of crime | Decrease |
| 16.3.1 | Incidence of cyber-crime | Decrease |
| 16.4.1 | Civil Court case completion time | Decrease |
| 16.5.1 | Criminal Court case completion time | Decrease |
| 16.6.1 | Incarceration rate | Decrease |
| 16.7.1 | Proportion of the population with high levels of confidence in selected institutions | Increase |
| 17.1.1 | Statistical Performance Indicators | Increase |
| 17.2.1 | Total official support for sustainable development | Increase |
| 17.3.1 | Exports of environmental and clean technology goods and services to developing countries | Increase |
References
Destatis. Indicator status summary.
Eurostat (2021). Sustainable development in the European Union - Monitoring report on progress towards the SDGs in an EU context.
Eurostat (2014). Getting messages across using indicators - A handbook based on experiences from assessing Sustainable Development Indicators.
Gennari, P. and D’Orazio, M. (2020). Statistical approach for assessing progress toward the SDG targets. Statistical Journal of the IAOS, 36, 1129–1142
OECD (2019). Measuring Distance to the SDG Targets - An Assessment of Where OECD Countries Stand.
UN DESA (2020). Sustainable Development Goals Progress Chart 2020 - Technical Note.
Bidarbakht Nia, A. (2017). A weighted extrapolation method for measuring the SDGs progress. UNESCAP SD Working paper series, 04, March 2017
Bidarbakht Nia, A. (2017). Tracking progress towards the SDGs: measuring the otherwise ambiguous progress. UNESCAP SD Working paper series, 05, May 2017
UNESCAP (2020). Progress Assessment Methodology.
Sachs, J., Kroll, C., Lafortune, G., Fuller, G., Woelm, F. (2021). The Decade of Action for the Sustainable Development Goals: Sustainable Development Report 2021. Cambridge: Cambridge University Press.
Notes
-
For a detailed description of the methodology, please refer to Eurostat (2021). ↩
-
All thresholds are standards in the international community. After assessment, it was found that they are also applicable in the Canadian context. ↩
-
Fifteen years is the expected validity period for the methodology (generally from 2015 to 2030). ↩
-
For more details on aspects of the methodology such as the scaling factor, please contact us. ↩